 Submitted by matt_eaton
on Sun, 04/22/2018 - 11:03 AM
Submitted by matt_eaton
on Sun, 04/22/2018 - 11:03 AM


Debugging network issues no matter what platform you are on can be challenging. Often, the deeper you dig into the operating system the harder it can be to analyze and accurately interpret the network traffic you are seeing. And working with iOS is no different. Debugging iOS traffic from a device to a router or from a device to a server can present many challenges. Often you may find yourself sifting through thousands of encrypted packets trying to make sense out which packets belong to what tcp streams and trying to draw sensible conclusions from just the transmission behavior alone. Fortunately, for iOS developers though, Xcode and Core Foundation provide some advanced networking debugging tools to help you gain insight on network traffic from the client vantage point. And that is why I wanted to write this article, to discuss some advanced network debugging techniques in Xcode and Core Foundation that provide valuable insights into the client side of the network traffic. And to discuss the advantages of these techniques over traditional network debugging techniques.
CFNetwork Diagnostic Logging 👨💻
Getting a complete picture of the network traffic in and out of an iOS device can be very difficult. Especially if you have a lot of traffic and your data is encrypted. One technique that can aide in your network traffic debugging is using CFNetwork diagnostics logging. Using this Core Foundation logging technique you can see de-crypted information on the stream data between the server and your client and the state of your connection as it is opened and closed at the kernel level. I was completely unaware of this feature until I stumbled upon it a couple months back while researching iOS TLS errors and how to properly diagnose them.
So how does CFNetwork diagnostics logging work in Xcode? In short, it’s an Xcode environment variable that you can use to set a log priority to direct Core Foundation to show you more or less information about the state of your network traffic. Setting the log priority to 0 will log minimal information about your traffic while setting the priority to 3 will log a lot of information. Using a log priority of 3 will also display the de-crypted stream data being read and written to the socket connection. This feature alone can be very handy if you are trying to diagnose data packets going in or out of your client without having to obtain the key to do so. Make sure to also keep this in mind if the data you are debugging is sensitive. Enough discussion on this topic though, let’s walk through how to set it up!
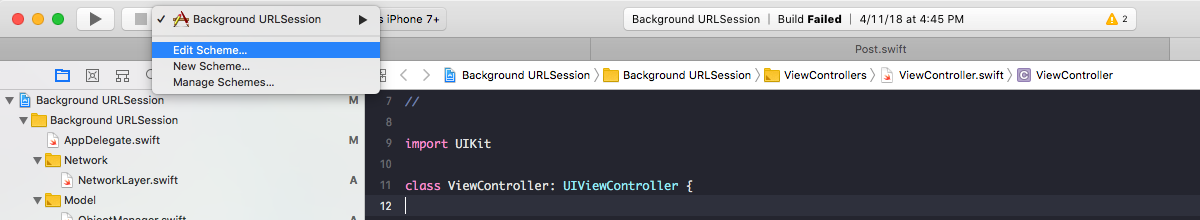
To get started with CFNetwork diagnostic logging the only thing you need to setup is an Xcode environment variable called CFNETWORK_DIAGNOSTICS with an attached logging priority. To do this, go to your app scheme and click, edit scheme:
Hit the run tab in the left column and hit the + button to add an environment variable. Add the CFNETWORK_DIAGNOSTICS flag and set the value to 0, 1, 2, or 3 based upon how verbose you want your logs to be.
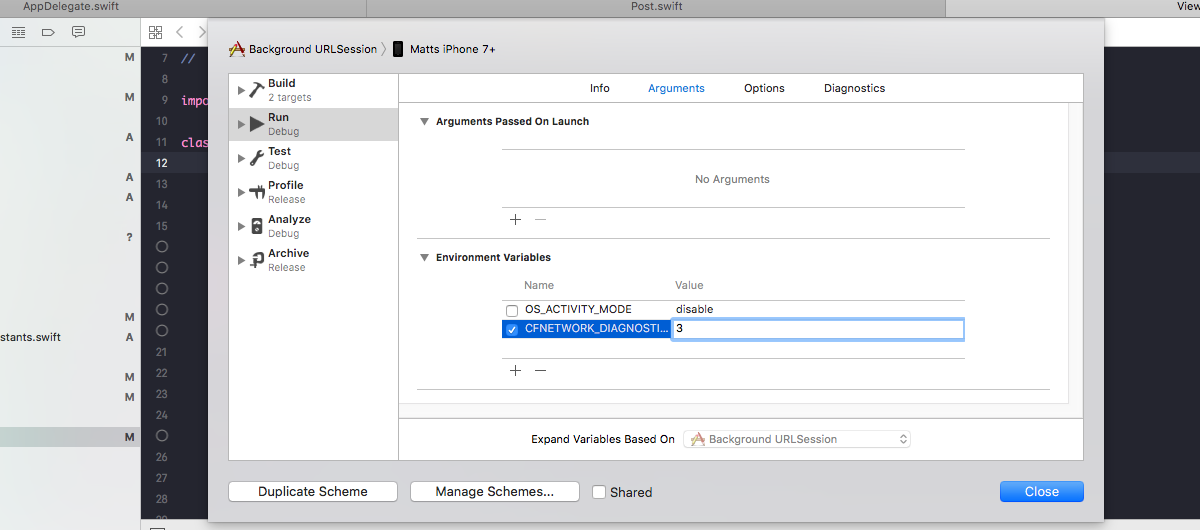
From here, you should be all set to run your application and see the networking logs. In the following screen shots, I have log priority set to 3. Which will be the most verbose and will provide the most useful information when debugging network traffic.
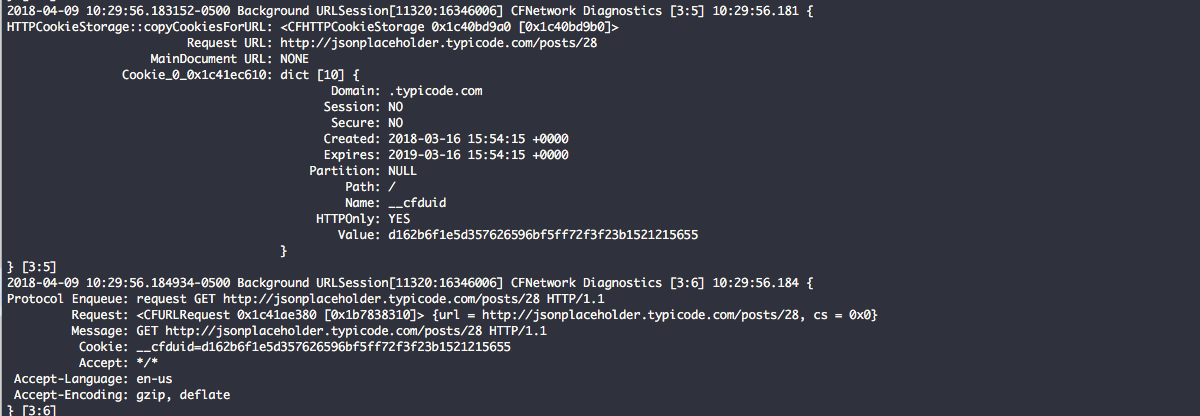
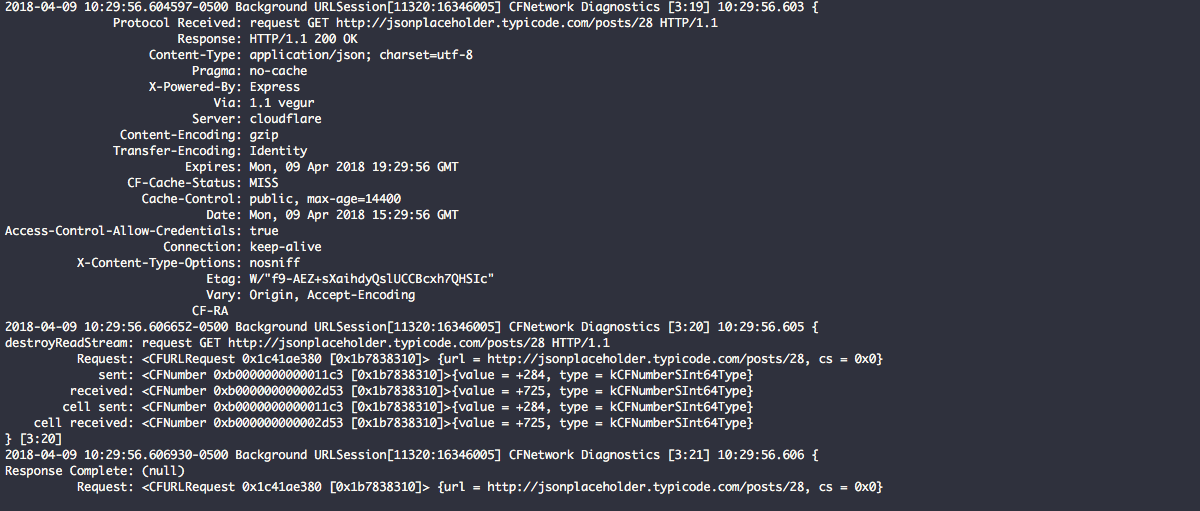
In the first screen shot below you can see the GET request going out to http://jsonplaceholder.typicode.com/posts/28. There are few a few thing happening in these logs. The first is HTTPCookieStorage has set a cookie in an array to the request URL: http://jsonplaceholder.typicode.com/posts/28 and displayed all of the values for the cookie. Next, CFNetwork is taking the CFURLRequest object and putting it enqueue to be sent out to the server.
In this next screen shot below you can see that the request has graduated to being a full blown socket connection and communication is taking place between the iOS client and the server. In this screen shot below you can see the data transmissions being sent and received. Notice the first two transmissions (284) are iOS writing the request and the cookie data to the writeStream of the connection that is being sent to the server. The third transmission (725) is the actual raw response headers from the readStream responding from the server in regards to our first two transmissions.
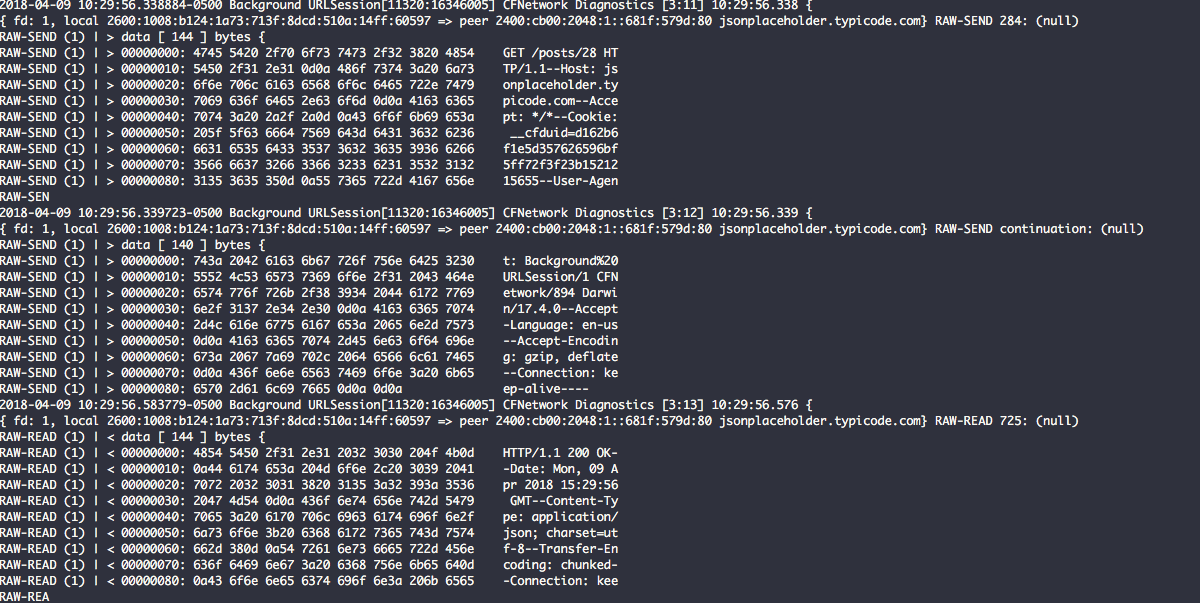
In this last screen shot below you can see the entire response received from the server (minus the JSON payload). This response includes all of the headers and a record of the transmission read from and written from the socket connection. These are the CFNumber values for 284 and 725. These values allow you to verify that all data was sent and received properly based upon what the client and server have negotiated.
Profiling Network Connections with Instruments 💻
Xcode Instruments allows you to profile network connections in your application just like you would profile memory leaks or CPU usage. Xcode Instruments can provide an informative look into the state of network connections by process or network interface on a device. One thing that Instruments does not do though is that it does not provide raw packet information like CFNetwork Diagnostic logging or Wireshark would. Instruments only provides a summary of all packets sent and received for the used connections, as well as high level information like host, port, protocol, interface, and remote addresses. In some cases Instruments may provide information on whether packets for a connection are re-transmitted, duplicated, or out-of-order, but doe go in-depth like Wireshark does for a specific tcp stream.
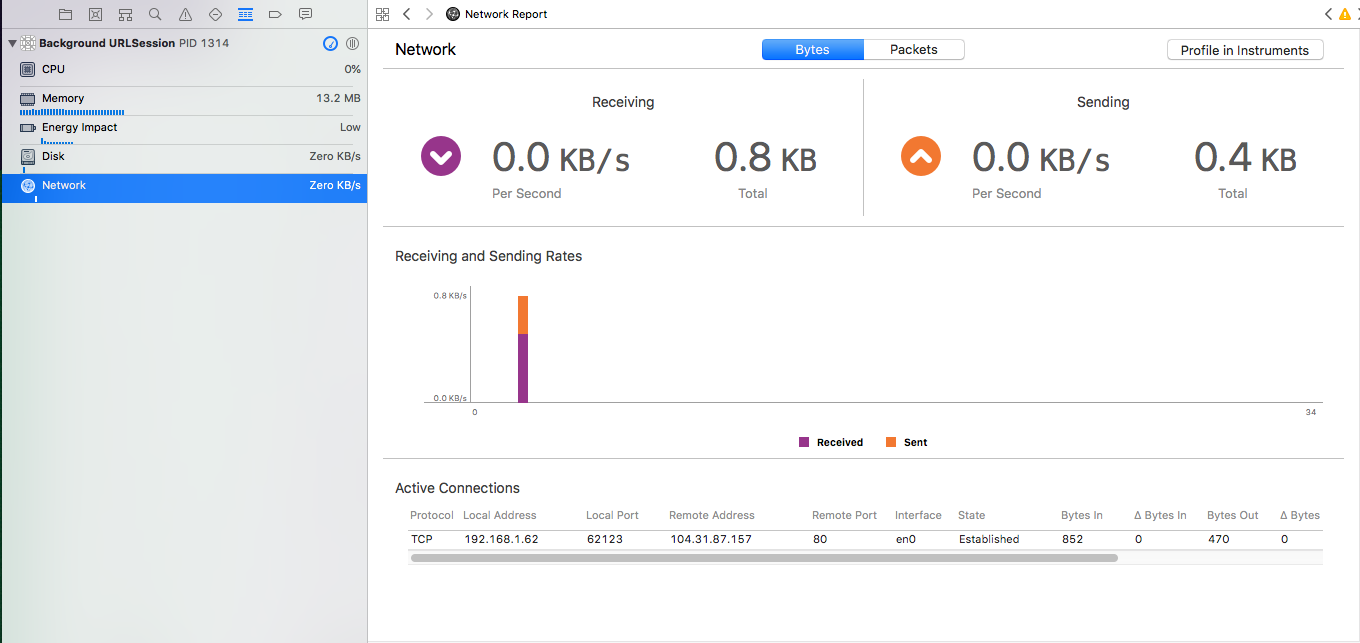
One other thing to note is that Xcode also provides an overview of active network connections running in your application right in the debug navigator without using Instruments. Below is a screen shot taken directly from Xcode. This is very similar to information that is provided in Instruments, but just for the running application only. You will find very similar information here, but just not as verbose as the overall picture in Instruments. Very handy for a quick look.
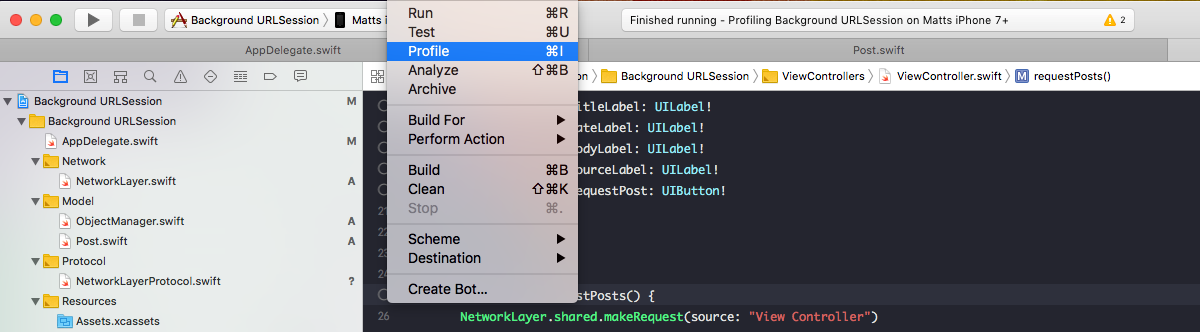
To get started using Instruments to profile network connections, simply hit Product -> Profile from the Xcode menu.
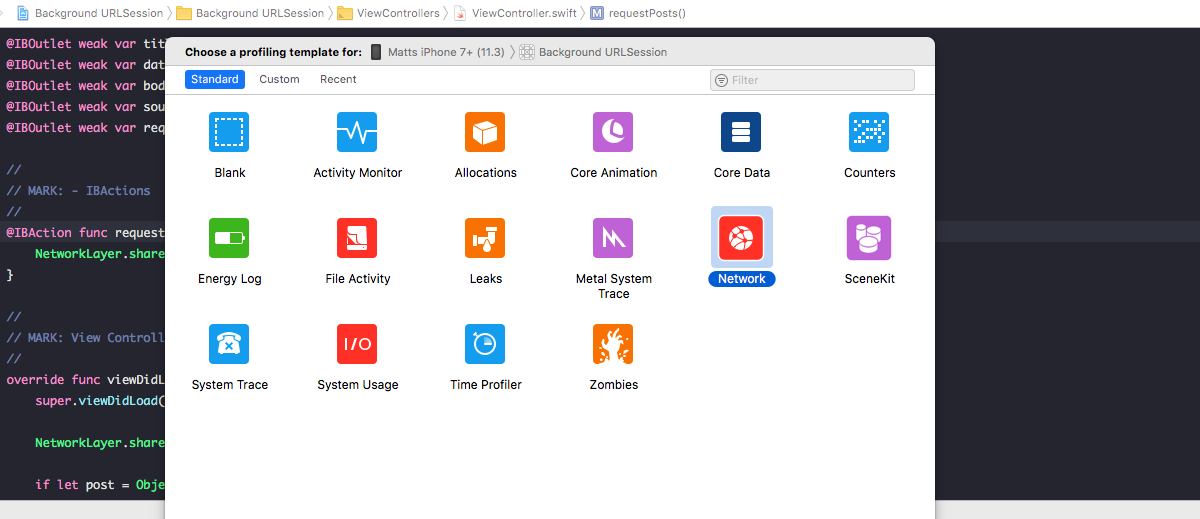
From here the Instruments process will start up and present you with a list of items you can choose to profile. Select Network and click "choose."
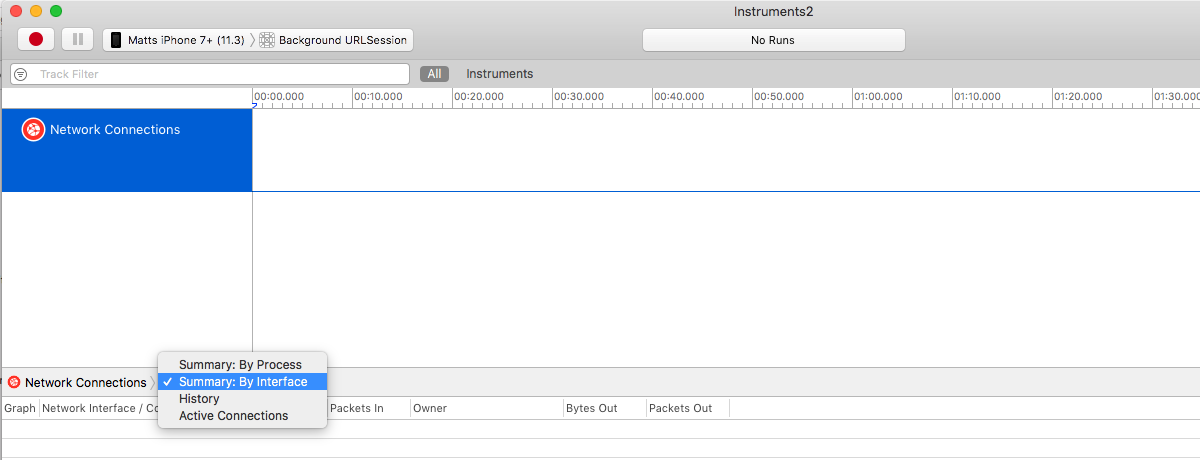
Once you select Network, the network connections UI will open and in the top left of the screen choose the device you want to profile the network connections on. In this case it is Matt's iPhone 7+ (11.3). Next, to the right of your device target the application. Once your device and application is configured, select how you want to capture your connections; by interface, by process, or by active connections only. In the case of this example I am capturing by process. Next hit the red button to start your capturing session.
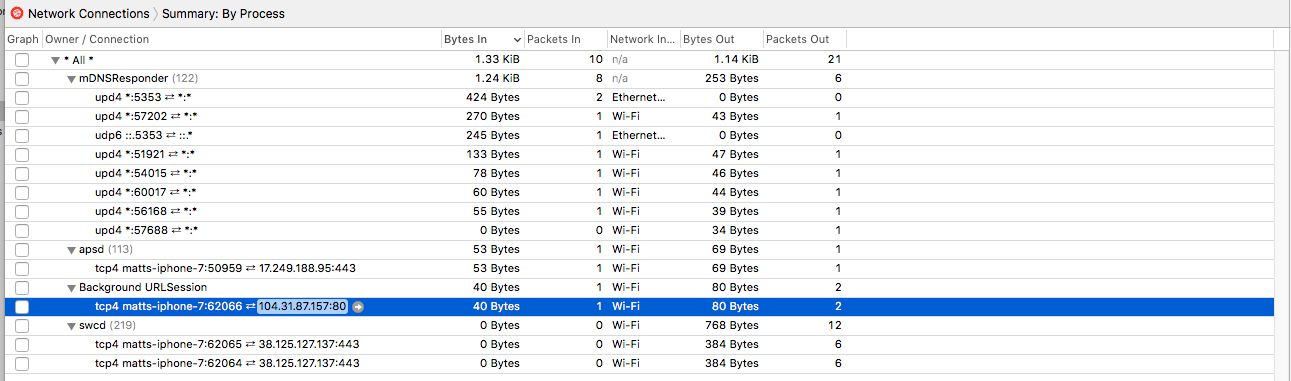
Once my capturing session is started I am not able to see my process for Background URLSession, mDNSResponder, apsd, and swcd all capturing active connections. Here in the screen shot below you can also see packets going in and out as well as data being read and wrote to the byte streams of the connection.
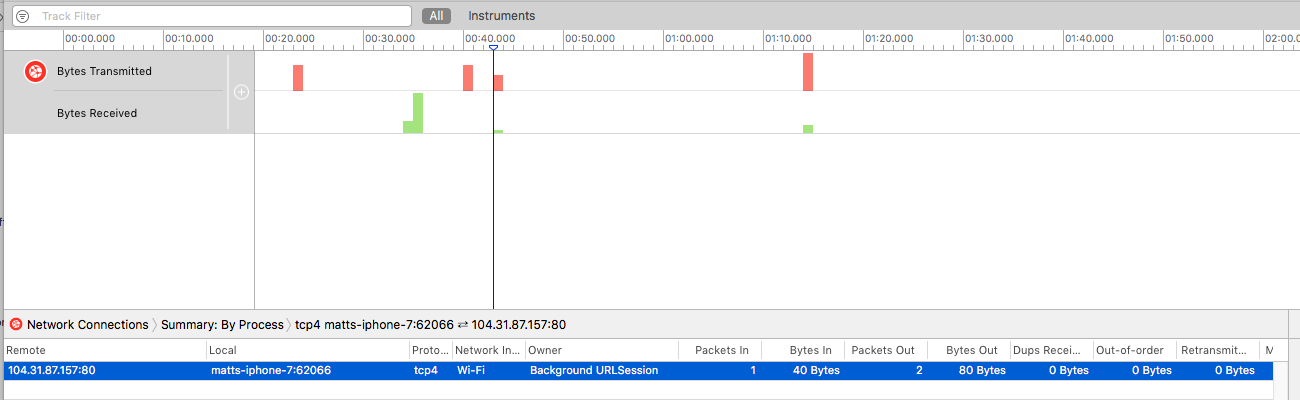
Lastly, let's take a look at the selected connection for Background URLSession. At first there may not appear to be much more information here than what is available on the active connections per process view, but if you take a look at the duplicates, out-of-order, and retransmitted columns, these are the key pieces of information that make this profile valuable. These values can tell you a lot about the state of the connection and if you are receiving packet loss or dropped connections. Also, notice how there are two packets out and one packet in, matching the CFNetwork Diagnostic transmission logs from above.
In Summary ⌛️
In summary, I hope you have gained some more insight about how to debug network traffic from Xcode a bit more efficiently. I know that CFNetwork Diagnostic Logging has saved me personally a lot of time just being able to see the data packets being transferred back and forth between the client and the server unencrypted. This traditionally is not the case when you do a tcpdump or grab a pcap with Wireshark. Also, utilizing Instruments to profile network connections can be very handy when reviewing individual connections to see if there have been any re-transmissions, out-of-order, or duplicate packets sent or received on your connection. This is also something that you will have to evaluate manually when using Wireshark or tcpdump. I hope you have enjoyed this article and please let me know if you have any questions comments or concerns as I would love to discuss more!

Member for
3 years 9 monthsLong time mobile team lead with a love for network engineering, security, IoT, oss, writing, wireless, and mobile. Avid runner and determined health nut living in the greater Chicagoland area.
Comments
Can't see RAW-SEND and RAW-READ
Hey there,
Firstly thanks for this. It is very helpful. Just one point. I see in your screenshot that you've got OS_ACTIVITY_MODE = disable. If that's left in, you get no diagnostics to the XCode (10.1) debug console. I have been tearing my hair out trying to get RAW-SEND and RAW-READ to show up. Where are you seeing that? I don't see that in the XCode logs. I see the CFNetwork Diagnostics 'preamble' stuff but no RAW-SEND and RAW-READ and I really need this to confirm an argument with a colleague :D. I have checked the Device logs. Nothing. Console shows the entries but still no RAW-SEND. I am using CFNETWORK_DIAGNOSTICS=3. Nada. Any suggestions. Could this detail be specific to the emulator? Frustrated..
Christian,…
Christian,
No problem! I'm glad you enjoyed the article. The OS_ACTIVITY_MODE = disable is unchecked. It was there but in order for CFNetwork logs to show up, it needs to unchecked. As for the RAW-SEND and RAW-READ, this should show up in CFNETWORK_DIAGNOSTICS=3 only. 1 and 2 will not contain this. I'll do a bit more debugging to see if this is something that was removed in XCode 10.1 and post an edit if so. Thank you for bringing this up.
Where to view the network logs?
Thanks for the pretty good info.
Where can I see the logs. I tried to view them in Console, but no success.
I have been using this…
I have been using this library with satisfaction because I am not happy with the default methods offered by iOS.