 Submitted by matt_eaton
on Sat, 06/11/2016 - 03:16 AM
Submitted by matt_eaton
on Sat, 06/11/2016 - 03:16 AM


Profiling memory allocations in a iOS project is probably one of my favorite things to do when building a project besides coding. Profiling gives you a sense of validation about how you have technically designed certain aspects of a project and it also gives you a sense of where you may have gone wrong and inadvertently created retain cycles, memory leaks, or zombies. I personally like to profile memory so I can have an end to end perspective about where memory is going and how effectively it is being used at different points in the project. I have always thought that the true elegance of an iOS program or any C program for that matter is in how effectively memory is being used. Memory usage is like an art, you can spend your whole career perfecting it and still think you are not using it efficiently. In the following posts I will give a brief overview on how to get started profiling memory allocations in your projects and also explain some of the different techniques I use when profiling memory.
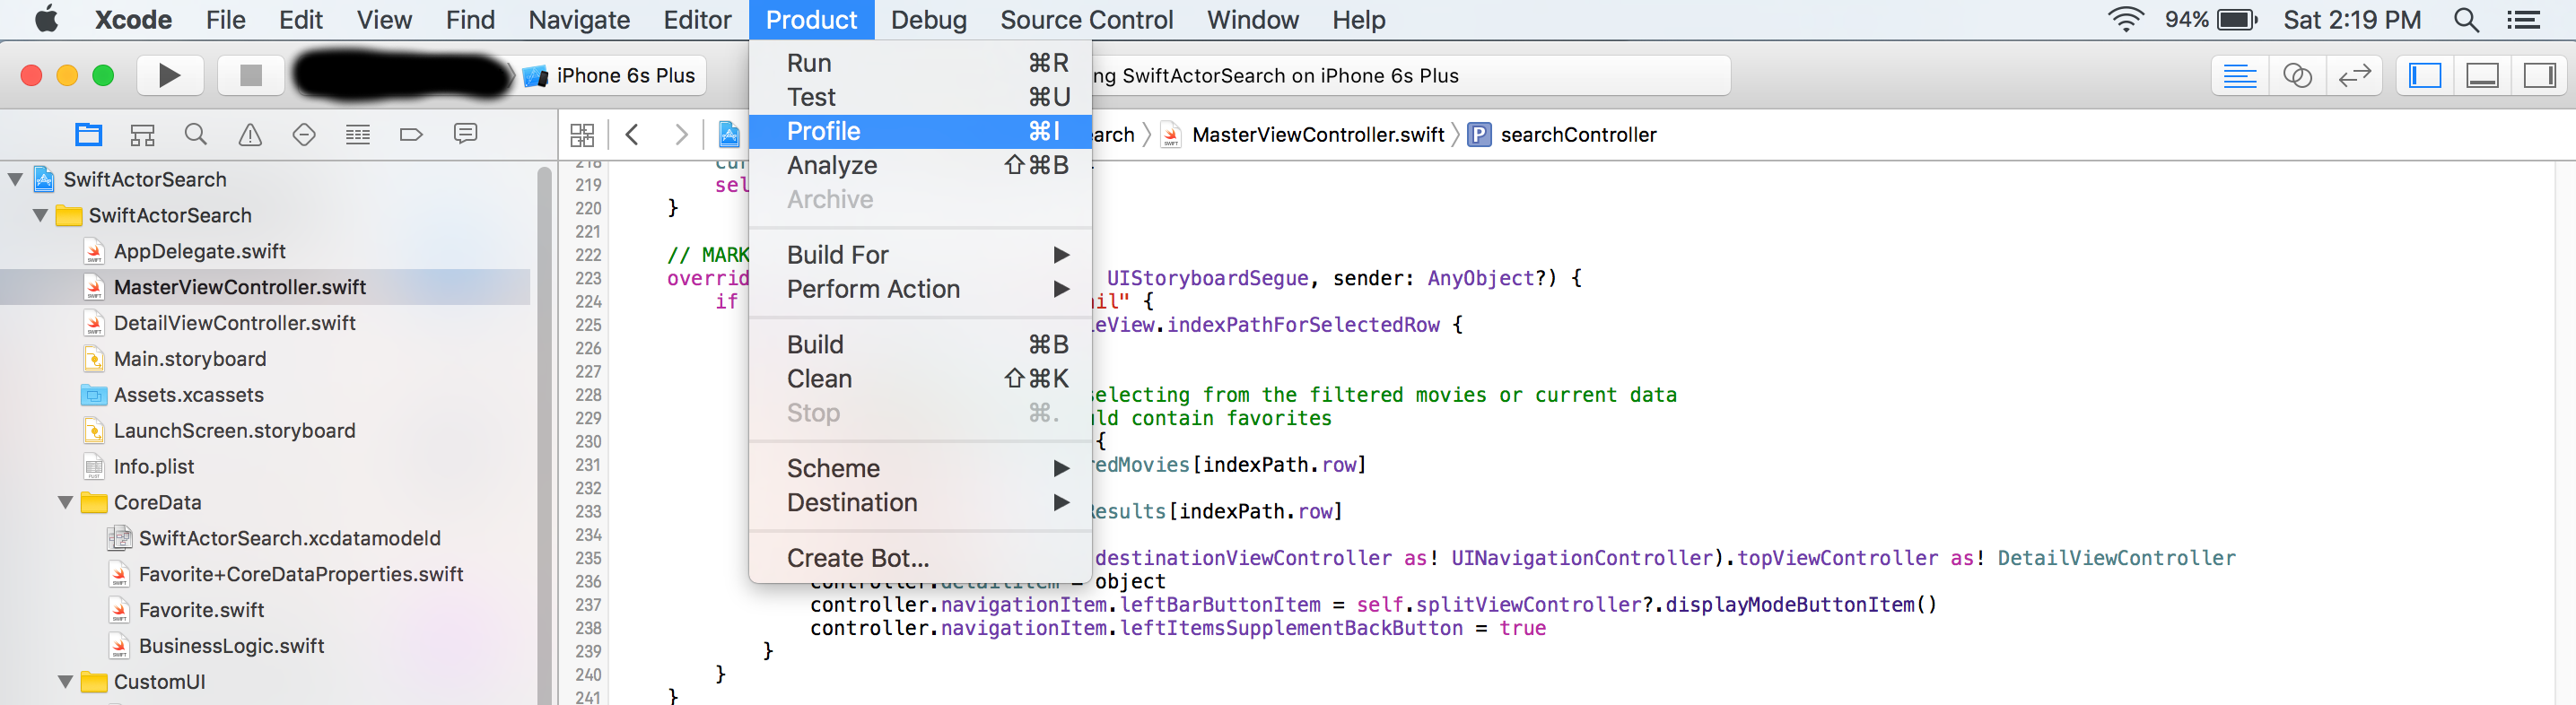
Profiling different aspects of your Xcode project can be done by using the Instruments tool. Once you feel that your project is in a place where you want to profile a certain aspect of your project, just simply click Product -> Profile, and Xcode will compile your Xcode project and prepare it be used in Instruments.
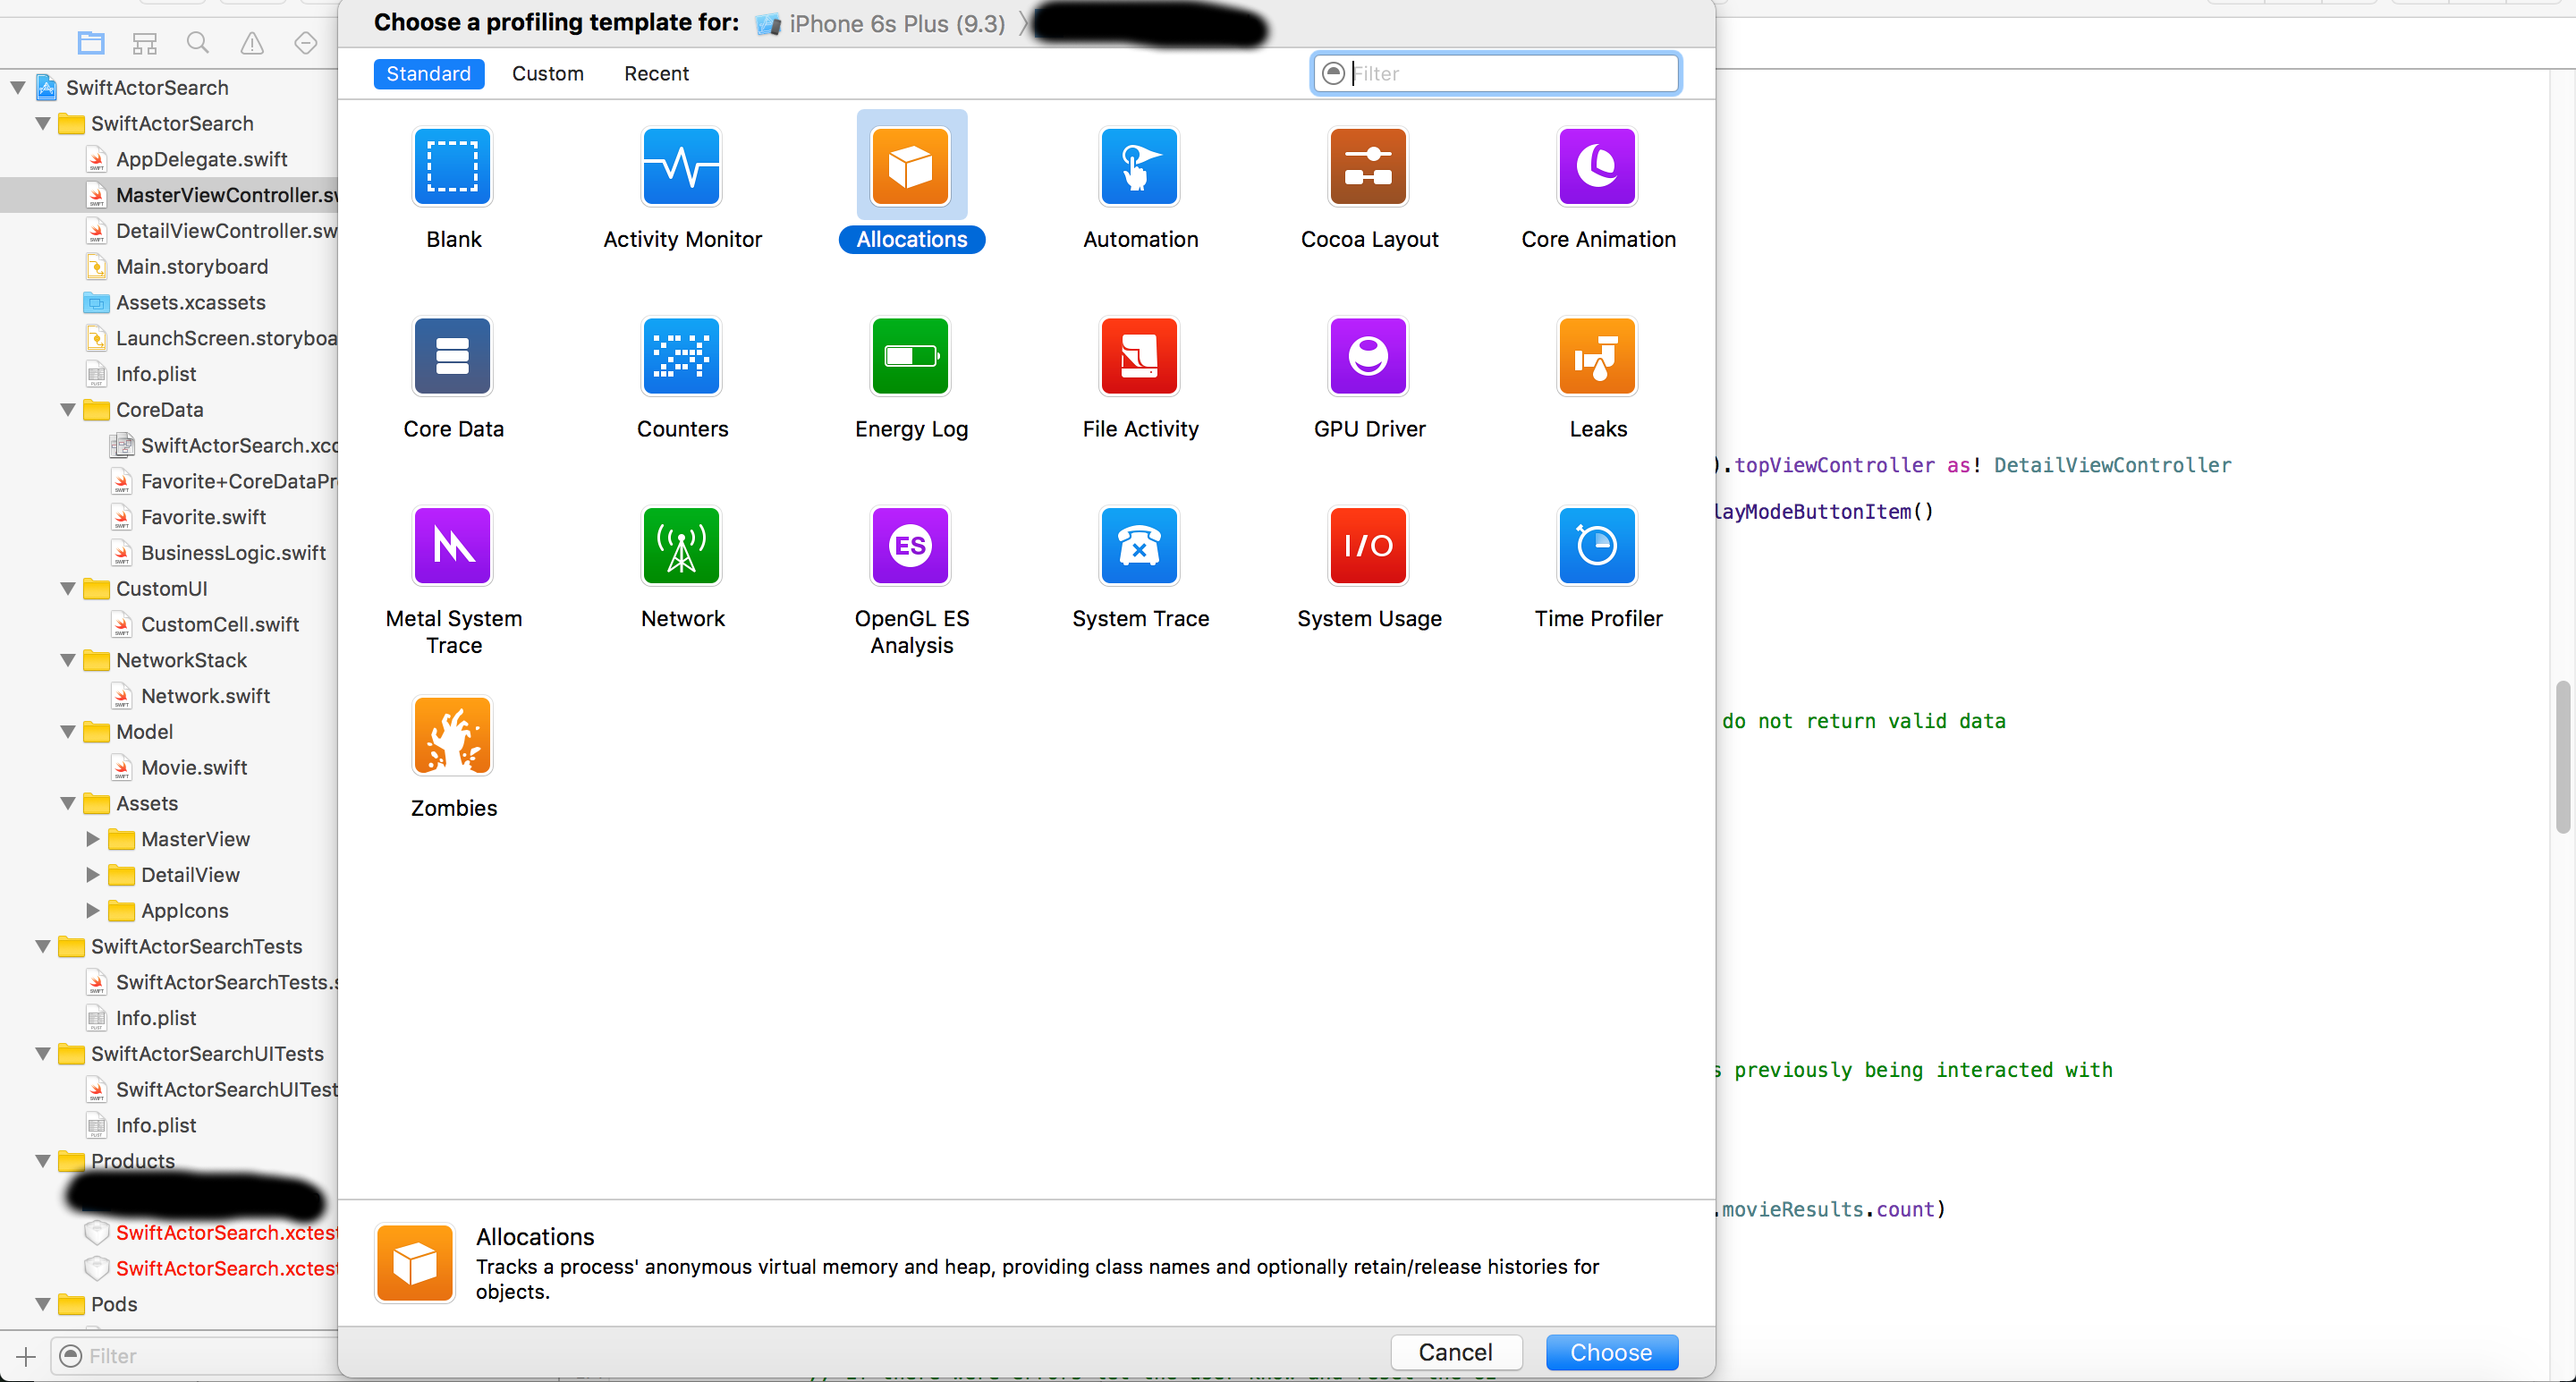
Once your project has compiled, Xcode will open Instruments and let you select which template to profile your project with. Select the Allocations template to view memory usage, object reference counts, and a complete chart of how much memory is being used by which classes throughout your project.
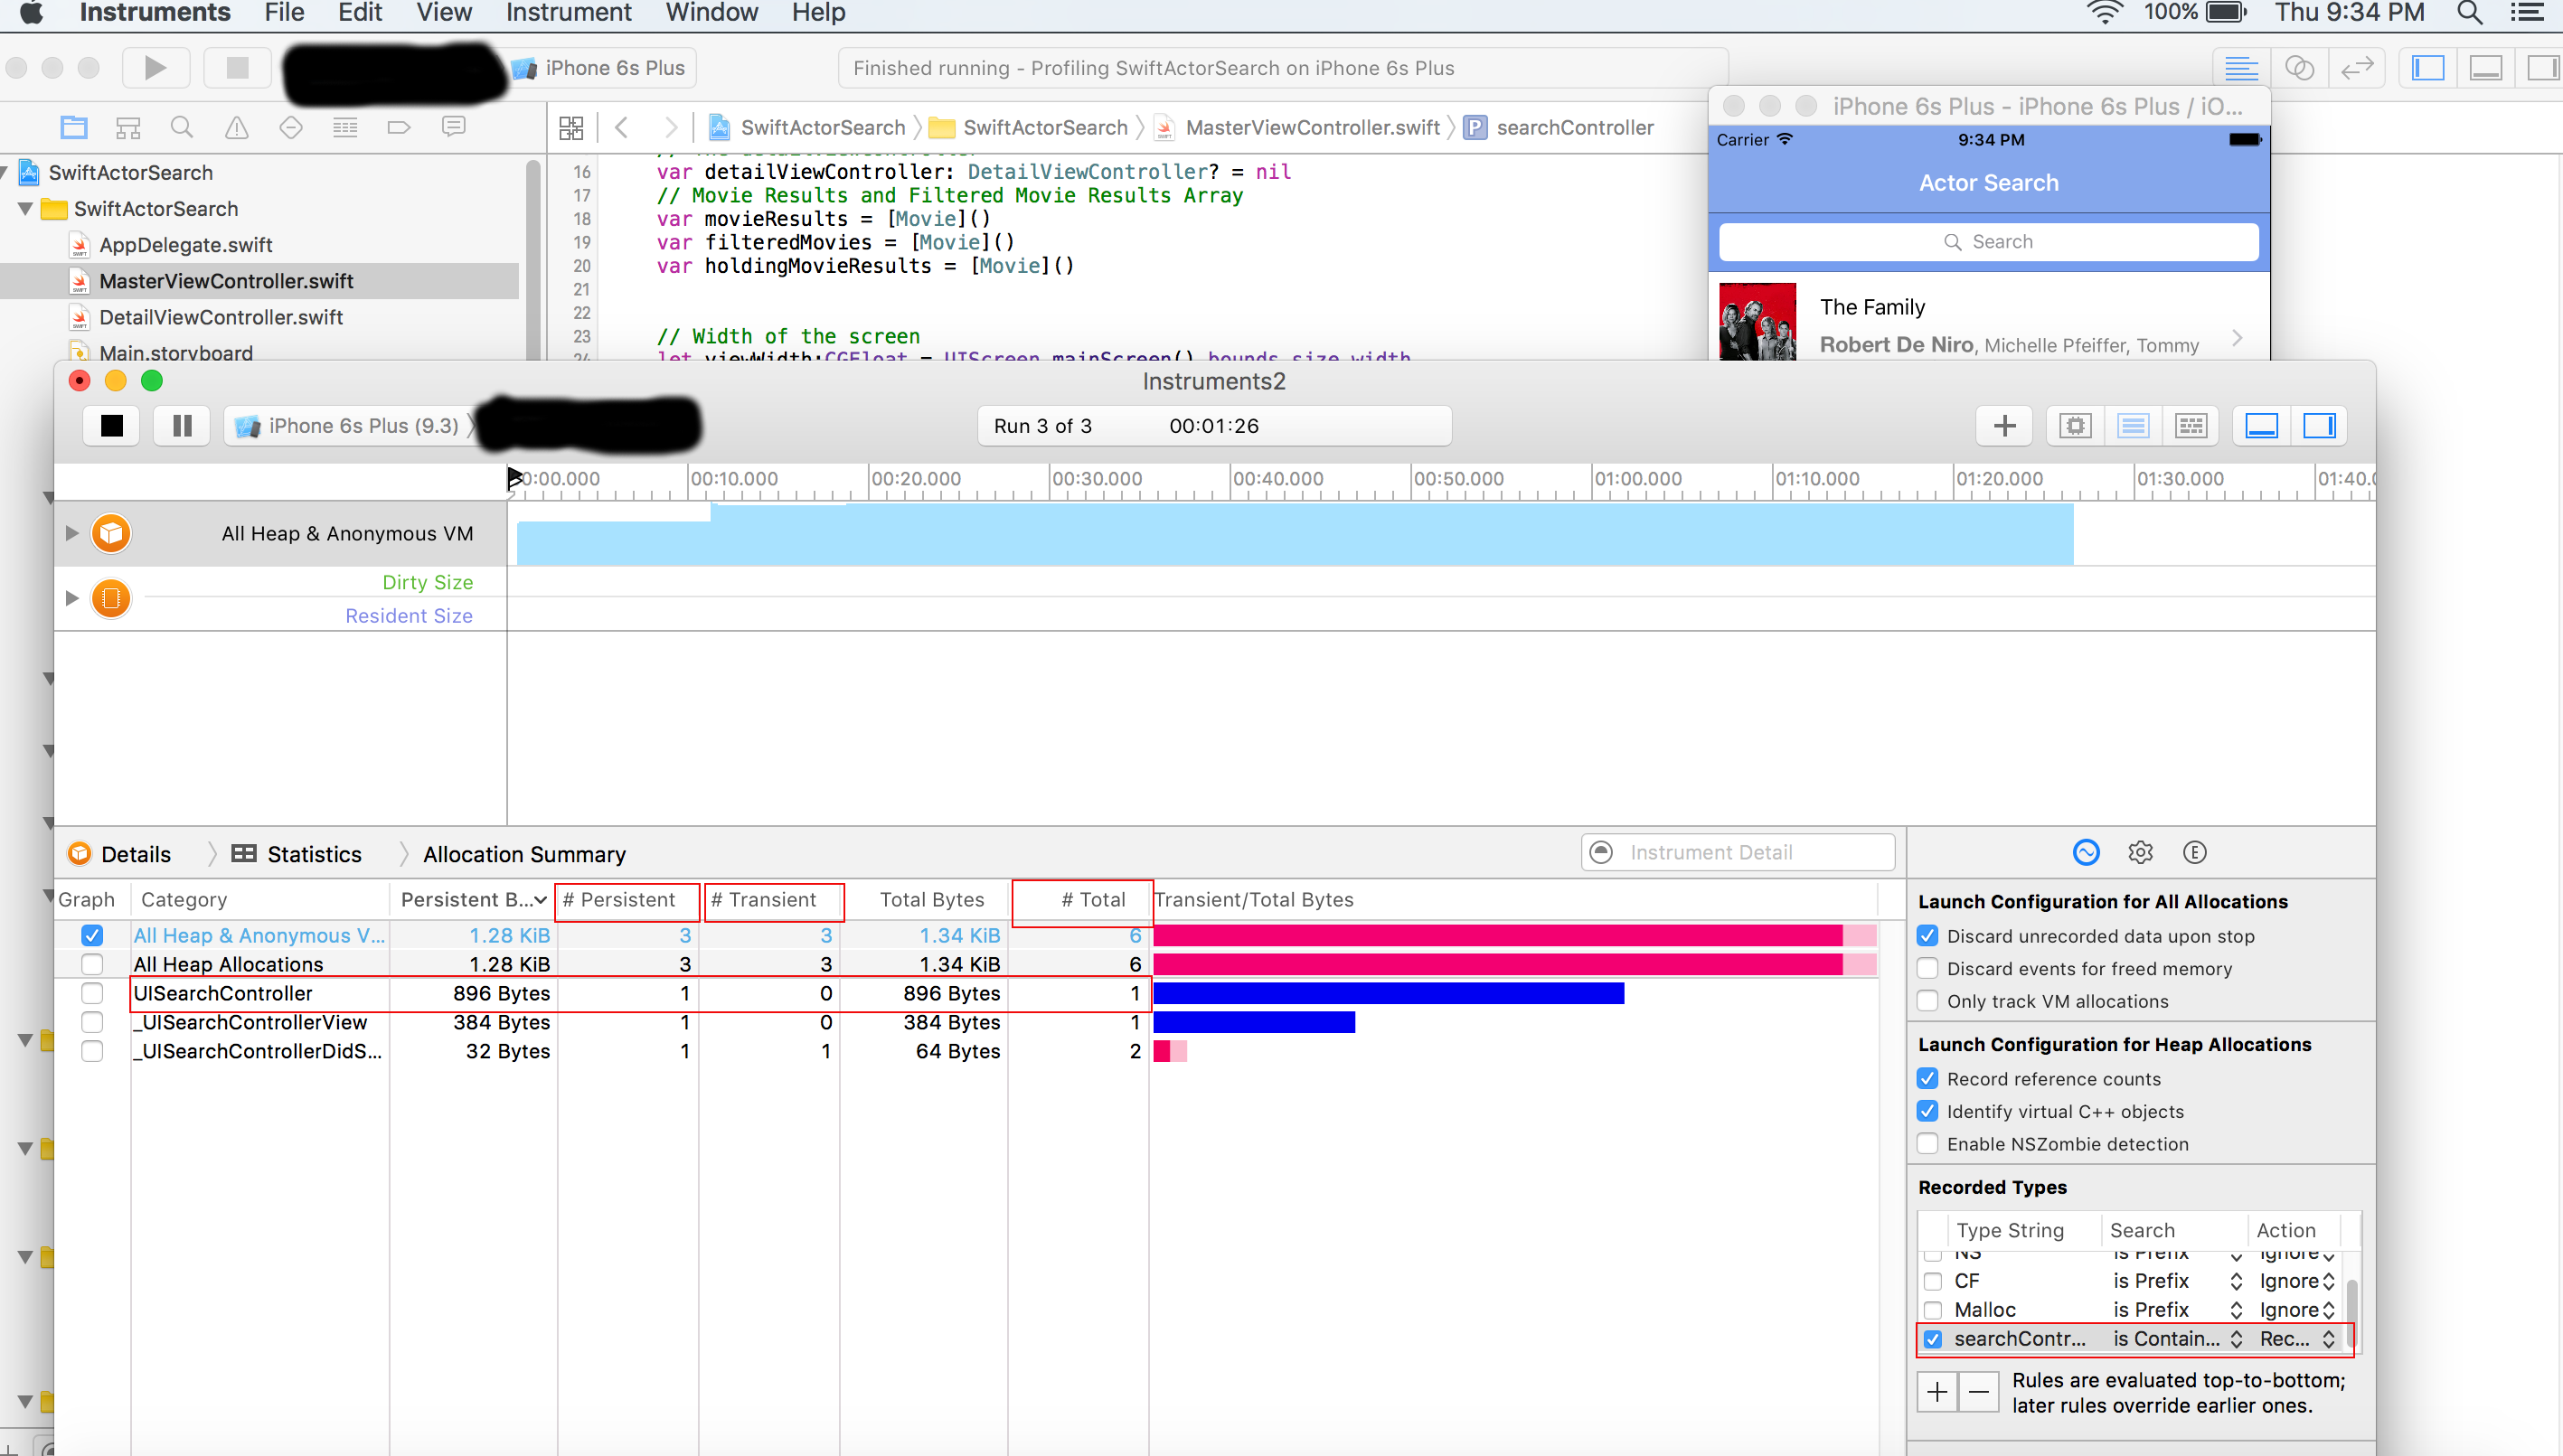
Once you select the Allocations template, click the button with a red circle to start recording your allocations. Also, at this point it is worth noting that I have always received the most accurate results when profiling my projects on an actual device and not a simulator. When your project starts it will start profiling all memory allocations used by all classes and libraries in use in your project by default. This is set by the default wildcard (*) option in the Recorded Types pane in the right side of the Instrument window. This is where you can choose to profile NS (Foundation), CF (Core Foundation), malloc (C's version of memory allocation), or lastly, your own custom objects. I, personally, like to take a survey of my project at different points during the development process and see if all memory is going where I think it should be going based upon my design and then target specific objects using the Recorded Types pane if I see a problem.
In the example above I am profiling a UISearchController object and you can see it it singled out because I have it checked as the only object I want to profile in the Recorded Types pane. Also, notice the three boxes I have highlighted in red on the top of the Allocation Summary table. The first says # Persistent. This is the number of persistent objects that are being strongly referenced in your project at this moment in time. The second says # Transient. This is the number of deallocated objects that used to be strongly retained but now no longer exist. This is handy because it lets you know if an object is being cleaned up properly or if an object in no longer retained in a particular moment in time. The third says # Total. This is the total count of persistent and transient objects added together. As you can imagine, this Allocation Summary table is extremely handy if you suspect that you have created a reatin cycle and you are not really sure where it is. Singling out your objects and profiling them by navigating around in your app should tell you exactly where the reference counts to your objects are stacking up and where they are being released.
As mentioned earlier, I wanted to talk about about some of my different techniques that I use for profiling memory based upon the style of iOS program I am writing. It has been my experience over the years that different programs call for different techniques in memory profiling.
Technique One, Profiling in Swift While Using Storyboards!
Using Swift and Storyboards seems to be the de-facto way that most develop projects these days. There is certainly nothing wrong with this method, but using Swift and Storyboards certainly can came with unexpected memory spikes that you were unprepared for. It has been my experience that singling out Swift objects to profile in some cases can not work as consistently as it does with Objective-C. As for Storyboards, I have seen Storyboards use memory differently than you would expect than if you developing the same layout programmatically. For this reason when I am developing a project in Swift that uses Storyboards I tend profile memory on a ViewController by ViewController basis during my development process just to make sure that I can capture anything that may have spiked the memory in my Storyboard or so I can be sure that I can capture all of my Swift objects that I need to profile.
Technique Two, Profiling in Objective-C While Using Storyboards and Without Storyboards!
At the time of writing this post I think that Swift is still not 100% appropriate for every project being developed on iOS. After all, Objective-C does have 18 years of maturity on Swift. So for that reason, there are projects still being done that I work on in Objective-C. Some use Storyboards when the layout is simple and some require the programmatic build of ViewControllers. When I am developing in a project that uses Objective-C with Storyboards I usually will develop one or two ViewControllers before I profile my allocations. Just because I reliably know that the Objective-C objects can always be found and measure by Instruments. When I am developing an Objective-C project that does not use Storyboards and the layouts are coded programmatically then I usually will take a look at the code that is being produced and make a judgement call on when is a good time to profile. If I see a section that looks unwieldy and could potentially be a bottleneck, then I will profile it. Otherwise I generally wait a good while before I profile Objective-C programmatic projects. Just for the simple reason that issues in these projects can generally be spotted by eye and potential issues are not abstracted away from you like in other circumstances mentioned above.
Technique Three, Profiling with Objective-C++ or C!
When using Objective-C++ and C in your iOS project it is good idea to profile often just to make sure that there are no interoperating issues being caused with data types while communicating between languages. Usually these issues are as easy to spot by eye as dealing with vanilla Objective-C is, but Instruments should be able to tell you when memory is being allocated and released so this is a huge help when dealing with different C dialects.
If you are new to Instruments you will notice in the image above that Instruments does not just profile memory, it can be used to profile just about every aspect of Xcode development, from core data, to I/O, to network usage. It does a great job and is an extremely handle tool that all developers should use when writing projects.
Let me know your thoughts on my profiling techniques, I would love to hear them. Thanks!

Member for
3 years 9 monthsLong time mobile team lead with a love for network engineering, security, IoT, oss, writing, wireless, and mobile. Avid runner and determined health nut living in the greater Chicagoland area.